Portfolio Visibility with Stacking Plan Software
See Your Entire Portfolio in One Clear View

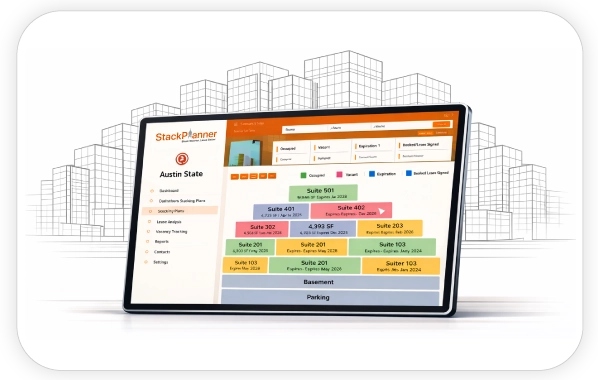
The Challenge
Managing multiple buildings often means switching between spreadsheets, PDFs, and reports. This fragmented view makes it hard to understand overall occupancy, risk exposure, and performance trends across the portfolio.
How StackPlanner Helps
- View occupancy across properties at a glance
- Compare buildings side-by-side
- Identify underperforming assets quickly
- Track tenant distribution and vacancy trends
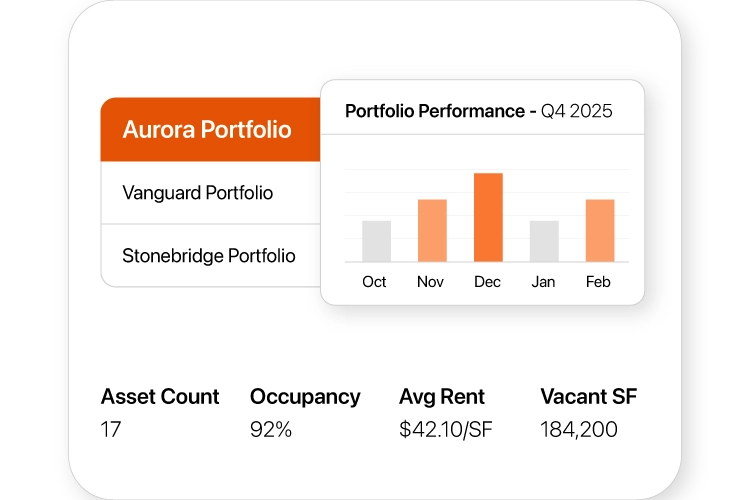
Results You Can Expect
- Unified portfolio oversight
- Faster, more confident decisions
- Reduced reporting and analysis time
Your Questions, Answered
What is portfolio visibility in commercial real estate?
Portfolio visibility in commercial real estate refers to having a unified, real-time view of occupancy, tenants, vacancies, and risks across multiple buildings. Tools like StackPlanner provide portfolio-level dashboards that replace fragmented spreadsheets and reports.
How can portfolio managers view multiple buildings in one dashboard?
Portfolio managers can use portfolio visibility software like StackPlanner to centralize building data into a single visual dashboard, enabling side-by-side comparison of occupancy, tenant mix, and performance across properties.
Why is a unified portfolio view important for CRE decision-making?
A unified portfolio view helps CRE teams identify trends, underperforming assets, and risks faster, leading to more confident decisions and reduced reporting time.
What problems does portfolio visibility software solve?
Portfolio visibility software solves data fragmentation, manual reporting, lack of trend insights, and difficulty comparing building performance across a real estate portfolio.
How does StackPlanner improve portfolio oversight?
StackPlanner improves portfolio oversight by visually displaying occupancy, vacancy, tenant distribution, and trends across all buildings in one clear, interactive interface.